I’ve put this compilation together to help marketing professionals create direct response conversion models for digital marketing campaigns. Through creating budget models using known benchmarks for clickthrough rates and average costs for digital media, you can better forecast your return-on-investment from digital media ads.
This data is particularly useful if you haven’t previously invested in advertising on publisher sites through ad networks or paid social media ads since it can help make the case and set expectations with colleagues or clients of the number of visits based on quantitative forecasts.
To learn more about online advertising options across you can download our Digital Media Options Cheatsheet to check techniques you may be missing out on.

Through 2020 we will update our statistics summaries with the latest research as it becomes available. Stats are in three sections which answer these questions:
As of September, the Q1 2020 ad benchmark report from AdStage is still the most up to date industry source. Naturally, it’s been a very challenging year for marketers, so we will make do with this report for now. Here are the stats and summaries for their clients in North America:
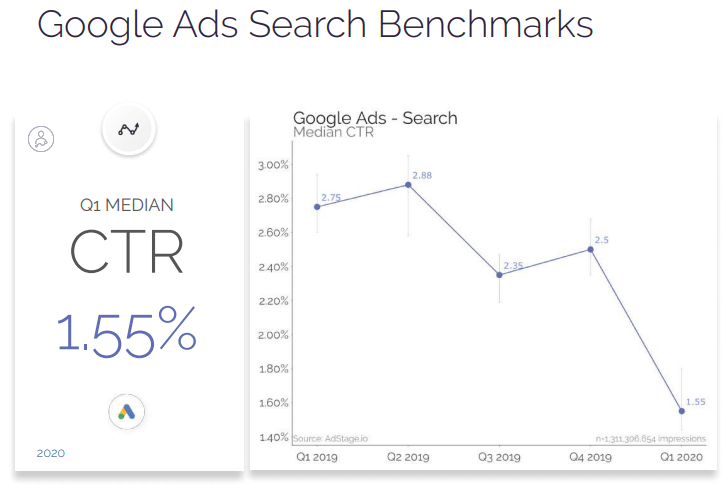
In Q1 2020, median CTR for ads on Google Search decreased from 2.5% to 1.55%. CTR
remains lower than we observed in 2019, down 44% year over year.
Key Takeaways
● CTR decreased by 38% since Q4 2019
● CTR decreased by 44% year over year since Q1 2019
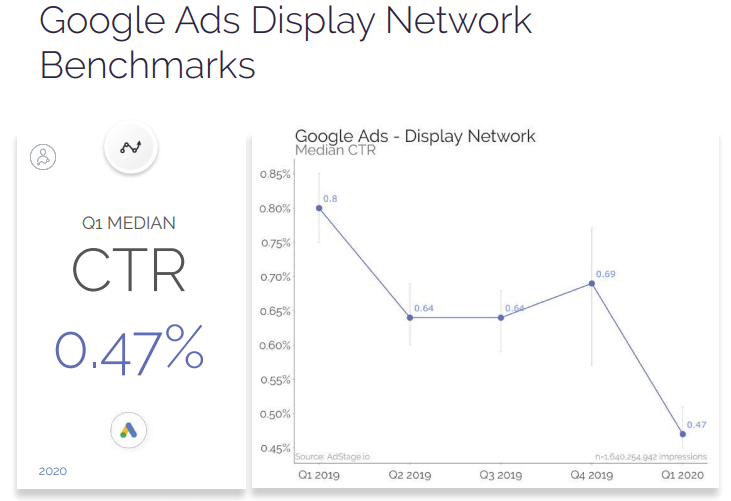
Median CTR for ads on Google Display Network decreased by 32% since last quarter. CTR
fell below last years performance, coming in 41% lower year over year.
Key Takeaways
● CTR decreased 32% since Q4 2019
● CTR decreased 41% year over year since Q1 2019
Unfortunately, Google has removed Doubleclick. So now we can only present previous data. No other alternatives are available as far as I’m aware. Please let me know via LinkedIn if you have good quality representative data we can share.
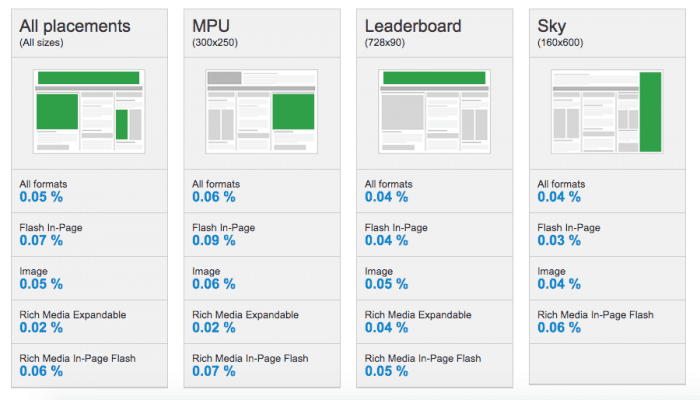
Previous Doubleclick data shows just than 5 clicks per 10000 impressions, showing the difficulty of driving direct response from online display or banner ads. Perhaps that is why Google no longer publishes this data…
While this is a really low CTR, however you look at it, cross-media optimization research we have seen show that online ads do help increase brand awareness and purchase intent, particularly when combined with offline media.
It’s not the case that the majority of ad viewers have ‘banner blindness’ and are not aware of ads which are viewable placements. If this were the case, businesses wouldn’t invest in the level of display and programmatic ads that they do.
Tests from the likes of Dynamic Logic and Millward Brown conclusively show that display ads also encourage site visits (view throughs) and searches even where people don’t click on ads.
We also see much higher CTRs online for other online ad formats like Google AdWords and Facebook – these can exceed 1%, so are more effective in driving volume and also typically have higher intent, so conversion rates are higher.
Download Business Member resource – Digital media options cheatsheet
We track all the changes made each week to identify the most important ones that every ‘hands-on’ marketer needs to be aware of to test the latest approach to improve marketing for their business.
Access the Digital media options cheatsheet
Again, we will use the Q1 2020 ad benchmark report from AdStage as our primary data source. Here are the media CTRs for their clients in North America:
The average Facebook CTR in the newsfeed is 1.11%. This is trending downwards; a decrease of 0.37% compared to the previous year.
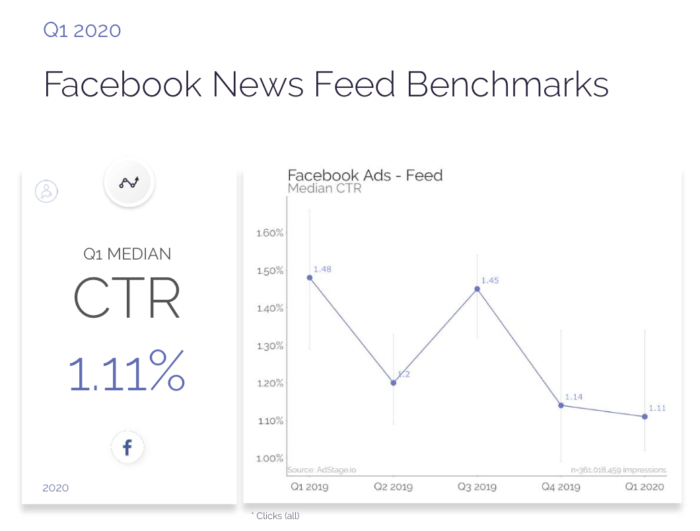
Other data reported includes:
Nanigans have a Q3 2019 Facebook benchmark report which breaks out different forms of ads – these have a higher CTR:
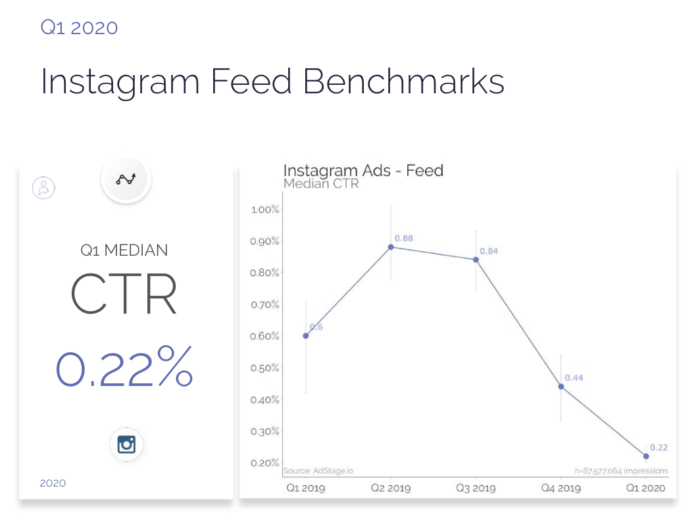
Instagram ad clickthrough rate in the feed is 0.22%, significantly lower than in the previous year and much lower compared to Facebook. This reflects the visual nature of Insta which doesn’t offer opportunities for CTR in organic newsfeeds (other than Stories). Benchmarks for Stories are a little higher at 0.33%.
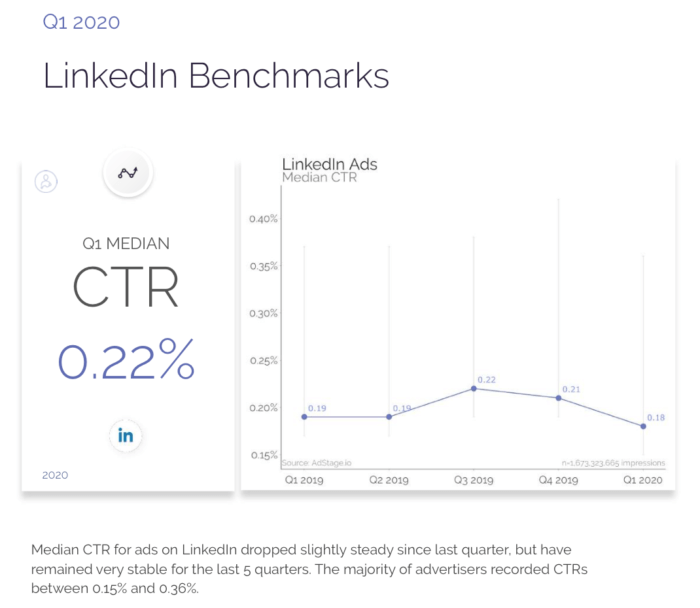
Although the audience is quite different since LinkedIn targets B2B audiences, there is a similar CTR in LinkedIn of 0.22%.
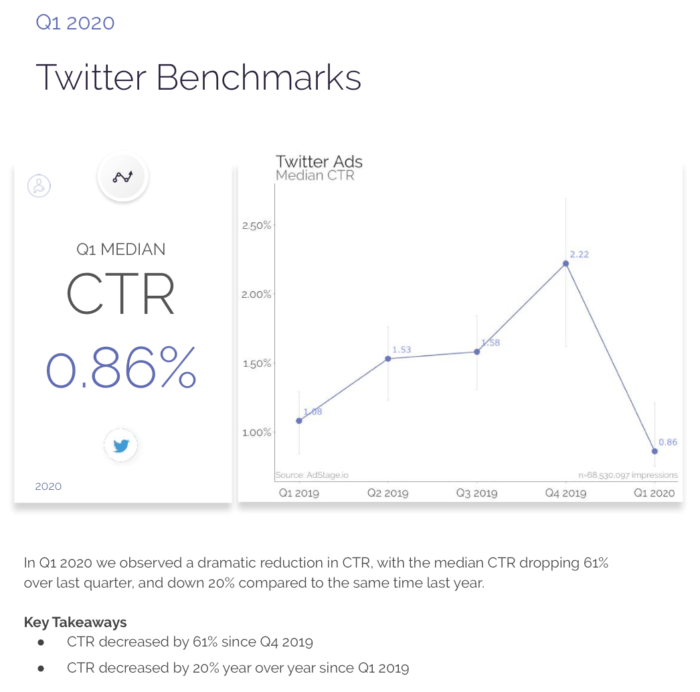
Twitter Ad CTR
Twitter has a higher clickthrough rate, although there is a significant decrease in the last quarter. Fewer impressions are served to Adstage customers in this category so this insight should be treated with caution.
Other media reporting services like Social Bakers and the Merkle Digital Marketing benchmark reports also have useful reports benchmarking different advertising metrics across organic and paid search (Google Ads) plus different social networks, but don’t report absolute CTR probably because this is not permitted by their terms of service with Facebook and Google. However, if you’re involved in improving your ad effectiveness we recommend reviewing the latest:
These statistics are courtesy of the Adobe Digital Index reports, published annually for their customers across 200 billion site visits.
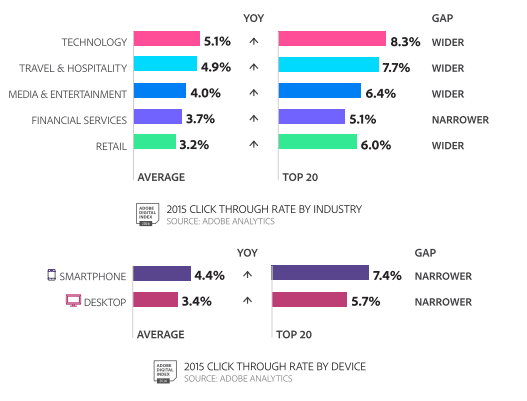
Of course, these figures are averages and in reality, CTRs tend to be higher for brand searches.
We also have a comparison of Google Clickthrough rates by position.
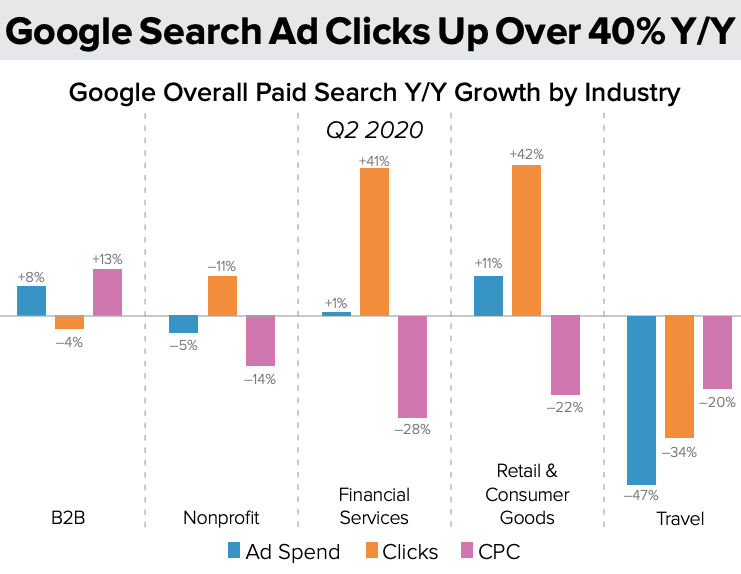
Although 2020 benchmarking research is not as plentiful as in previous years, there’s one thing we’re sure of – rapid changes in customer behaviour. Here’s a summary from the Merke Digital Marketing Q2 Report comparing Ad spend, clicks and CPCP against the previous year.
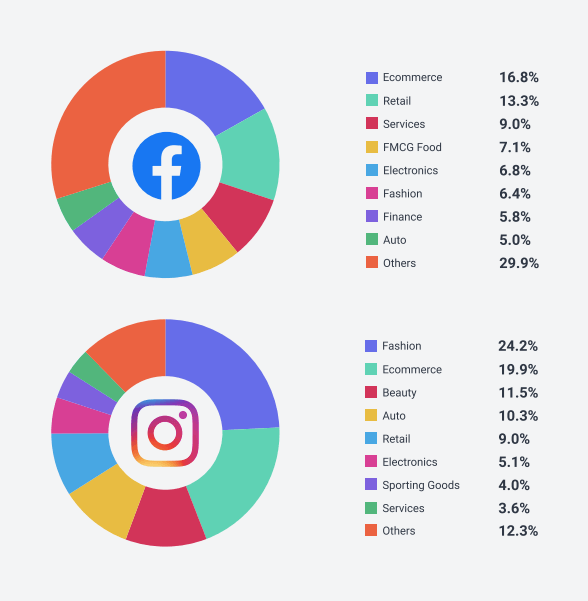
This interesting pie chart comparison from the Social Bakers Q2 Report shows which industries have received the most (and least) interactions on Facebook and Instagram in Quarter 2. It has certainly been a remarkable quarter, with ecommerce, featuring heavily in both Facebook and Instagram interactions – it will be interesting to watch if this trend continues as we adjust to ‘the new normal’.
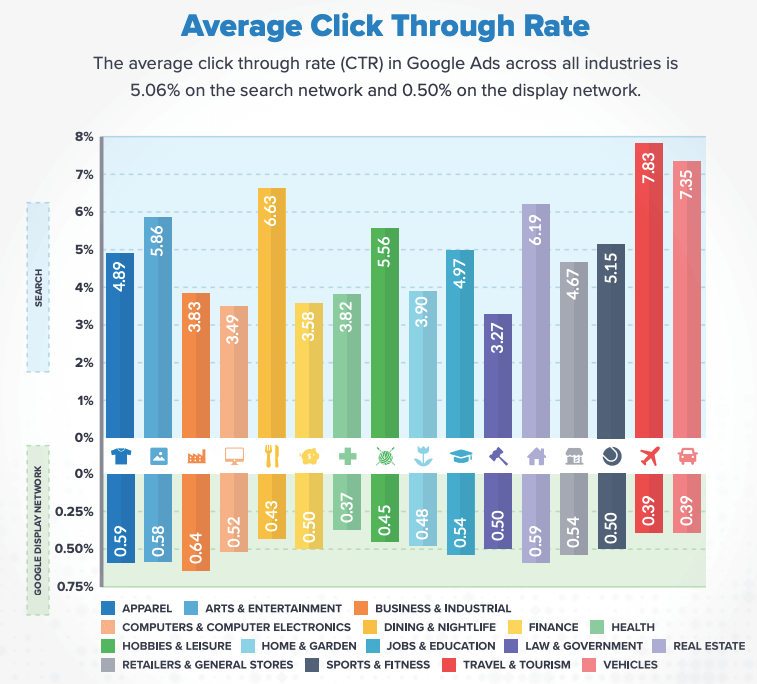
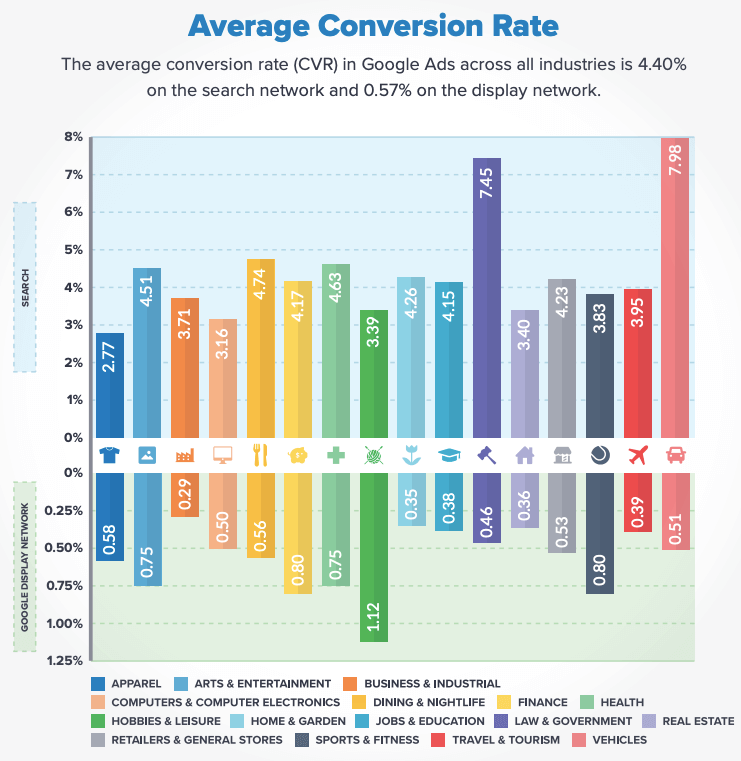
There is no detailed data for 2020 yet, but here’s the 2019 Google Ads engagement stats from WordStream – for clickthrough rates and conversion, broken down by 16 sectors.
These stats are higher than the Google average since they only represent accounts managed by WordStream.
“The average click through rate in Google Ads across all industries is 5.06% on the search network and 0.50% on the display network.”
Here, the highest CTR is for the travel industry, unfortunately the reports from 2020 (covered above) tell a different story.
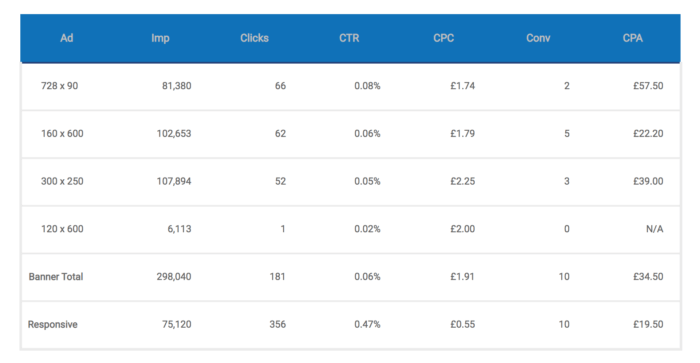
Note that more recently Google introduced Responsive Display ads on the Google Display Network as the default ad type. These involve uploading your assets (images, headlines, logos, videos and descriptions) and Google will automatically generate ads to be shown on the Google Display Network.
Reports from early adopters suggest that these can have relatively high CTRs. This example of CTRs compared a Google Ads campaign provided by Smart Insights Expert commentator David Miles. It shows the uplift he received when testing this new format.
Since the Google-Doubleclick data is no longer available we’re unable to update this data, but we have kept it in this post since it may be useful for readers to understand historic trends in CTR.
This comparison of average online media clickthrough rates from Marin is useful for modelling the response of digital media for top-level budgets.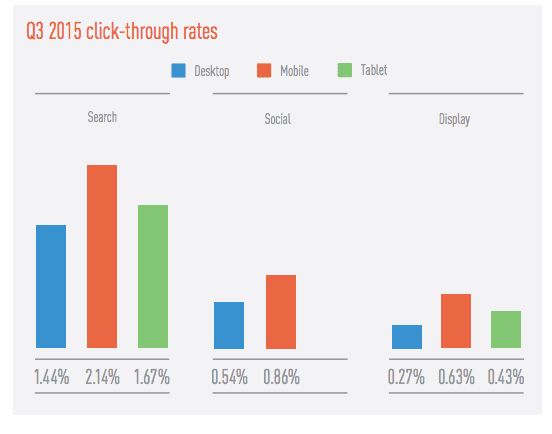
Facebook offers different forms of ad formats with different goals will naturally vary in response as these retail Facebook ads from. You can see that Facebook ad CTRs which may be more highly targeted that display ads have significantly higher CTRs, particularly for Lead generation (i.e. adding subscribers to a retailers email list) and Dynamic Product ads (retargeting visitors who have already visited a site with relevant offers). 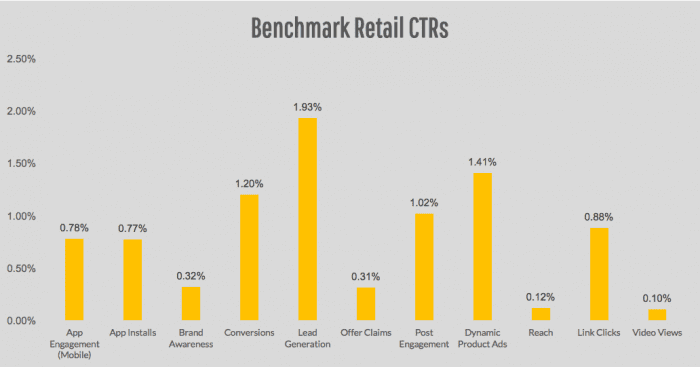
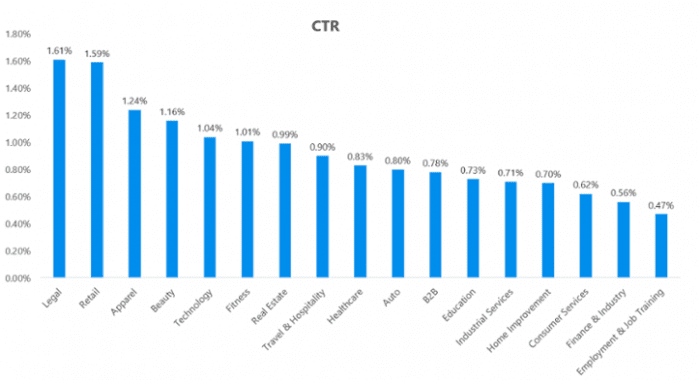
Wordstream also have these summary Facebook ad CTRs by sector:
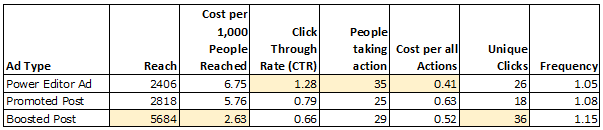
These Facebook Ad CTRs for different types of ad formats are taken from a test run by Smart Insights contributor Marie Page. They show that by using targeting in Facebook it’s possible to improve on general Internet ad clickthough rates.
Viewability is another issue for advertisers to consider when evaluating online ad effectiveness as measured by clickthrough rates. Ad blocking also has an impact since ad blockers have increased in popularity across countries and demographics, accounting for 35% of ads in some countries.
Viewability refers to the percentage of ads in a campaign or on a publisher site that are potentially available for clickthrough. Just 44.9% of all ads are clickable according to Google-published viewability data since ads may be below the fold and users do not scroll to see them. This varies across publisher and content category.
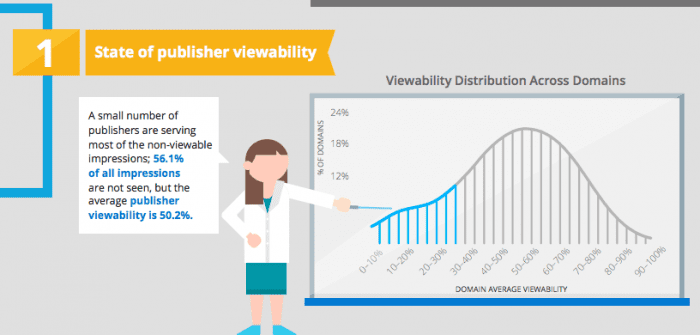
Given the impact of viewability and ad blocking on online ad clickthrough rates you can see that there are moves in the industry to only charge for viewable ads, which with increasing options for native advertising will potentially improve the effectiveness of ads.
This is historic data for reference – for the latest use the interactive Display benchmarking tool.
| Region | Overall Click-through Rate Percent (%) |
| North America | |
| Canada | 0.09% |
| United States | 0.10% |
| EMEA | |
| Austria | 0.11% |
| Belgium | 0.13% |
| Denmark | 0.12% |
| Finland | 0.05% |
| France | 0.12% |
| Germany | 0.11% |
| Greece | 0.17% |
| Ireland | 0.10% |
| Italy | 0.10% |
| Luxembourg | 0.09% |
| Netherlands | 0.14% |
| Norway | 0.11% |
| Spain | 0.12% |
| Sweden | 0.08% |
| Switzerland | 0.12% |
| United Arab Emirates | 0.18% |
| United Kingdom | 0.07% |
| JAPAC | |
| Australia | 0.07% |
| China | 0.12% |
| Hong Kong | 0.17% |
| India | 0.18% |
| Malaysia | 0.30% |
| Singapore | 0.19% |
Source: DoubleClick for Advertisers, a cross section of regions, January and December 2009, Published July 2010
Variation in online ad Clickthrough Rates by ad format
Ad clickthrough rate naturally varies according to placement (position on screen) and ad format (shape and size). The traditional full-banner performs very poorly compared to skyscrapers, the ubiquitous medium rectangle and the newer large rectangle format.

Interaction rates differ for different ad formats in a similar way to ad formats.

Interaction rate definition:
Interactions are defined as the user does one or more of the following:
[ad_2]
Source link
Digital Strategy Consultants (DSC) © 2019 - 2024 All Rights Reserved|About Us|Privacy Policy